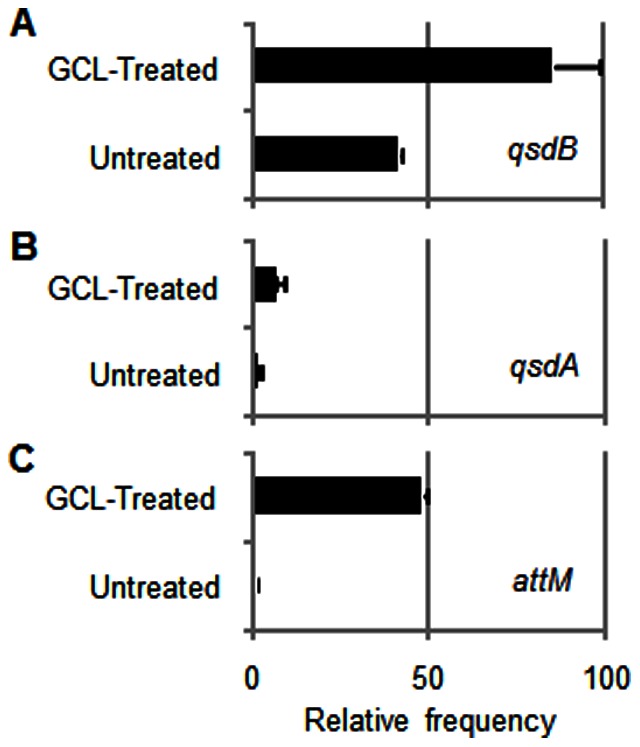
Figure 3. Relative abundance of NAHLase-encoding genes in GCL-treated and untreated plant cultures.

Relative abundance of the qsdB (A), qsdA (B) and attM (C) genes in GCL-treated and untreated batches at 42-day was measured by qPCR. The attM intensity under the untreated condition (C) was used as a normalized reference (arbitrary value = 1) for calculation of the relative abundance of all genes.
