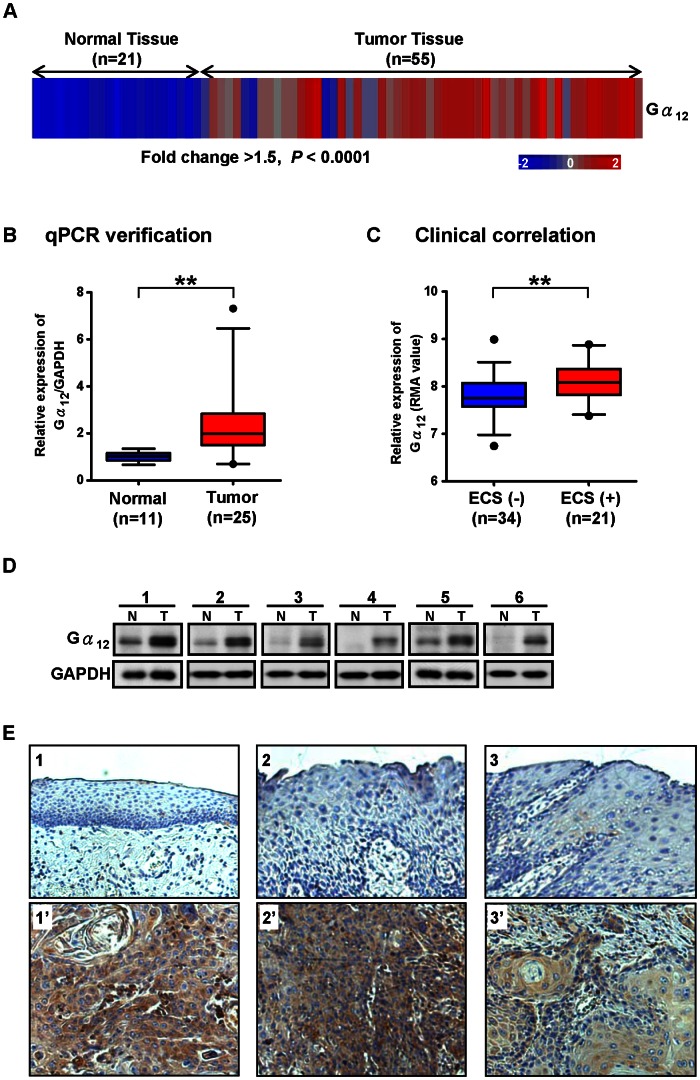
Figure 1. The up-regulation of Gα12 in OSCC patients correlates with Extra-capsular spread.
(A) The Gα12 expression is significantly up-regulated in 55 OSCC tumors compared to 21 normal control tissues (fold change >1.5, P<10−10). The microarray data was analyzed by two-way clustering. Each column represents an individual clinical sample. Normalized gene expression values were color coded in percentage relative to the mean: blue for values less than the mean and red for values greater than the mean. (B) Quantitative RT-PCR (qPCR) analysis of Gα12 in 25 OSCC tumors compared to 11 normal mucosa tissues. The results were normalized to GAPDH expression levels and then analyzed by t-test, **P<0.01. Box plots display the median, 25th and 75th percentiles. Whiskers represent 5–95 percentiles and dots the outliers. (C) The box plot shows the relative gene expression values (RMA, log2) of Gα12 for extra-capsular spread (ECS) positive (+) and negative (−) patients. Statistical results were analyzed by t-test, **P<0.01. (D) Western blot analysis of Gα12 levels in 6 paired samples of OSCC and adjacent normal/pre-cancerous tissues. The Gα12 protein levels were found to be markedly up-regulated in OSCC tumor tissues compared to the GAPDH loading control. (E) Representative immunohistochemical images for Gα12 staining patterns in the paraffin-embedded section of OSCC biopsies. Gα12 immunoreactivity was detected primarily in the membrane and cytoplasm of OSCC (lower panel). In contrast, the adjacent normal and pre-cancerous oral tissues of individual patients showed very low immunoreactivity (upper panel). Original magnification, ×200.

