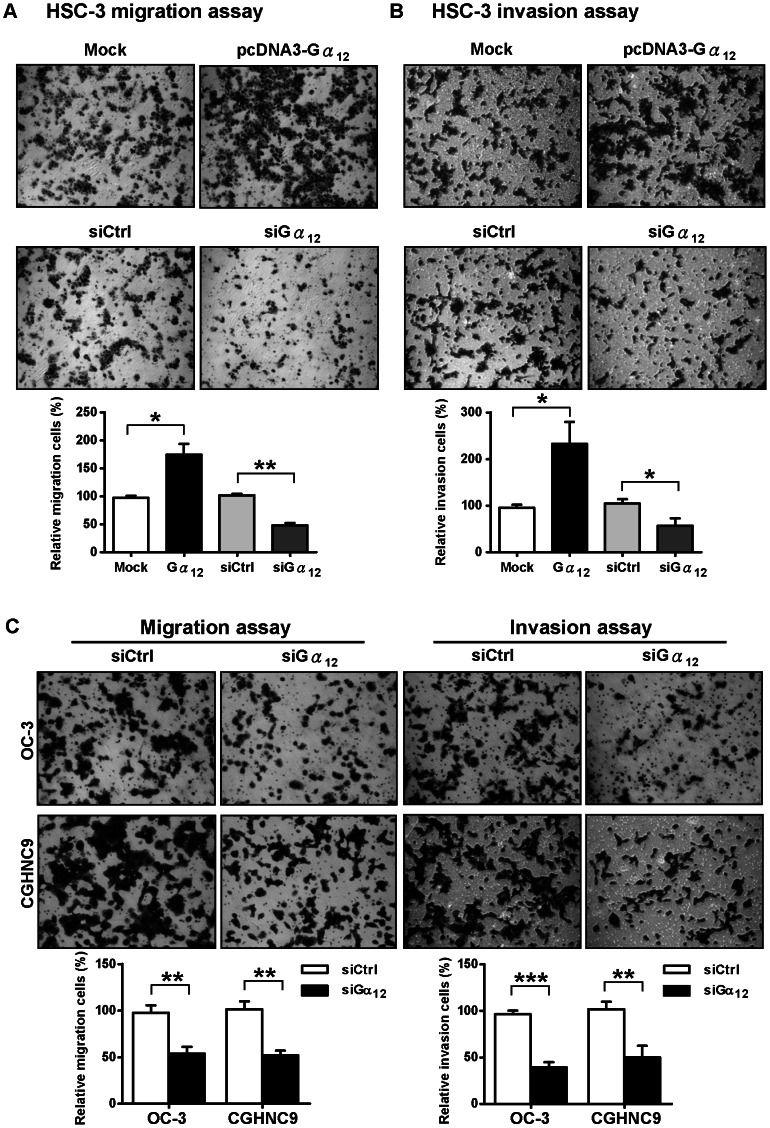
Figure 2. Gα12 promotes OSCC cell migration and invasion.
(A) The transwell migration assay of Gα12 overexpressed (Gα12), or Gα12 depleted (siGα12) HSC-3 cells stained with crystal violet. The lower panel shows the quantitative results by three independent experiments. (B) The transwell invasion assay of Gα12 overexpressed (Gα12), or Gα12 depleted (siGα12) HSC-3 cells. The lower panel shows the quantitative results by three independent experiments. (C) Depletion of Gα12 in two other OSCC cell lines (OC-3 and CGHNC9) also decreased cell migration and invasion. The knockdown efficiency and overexpression level of Gα12 in four different OSCC cell lines used in this study are demonstrated in Figure S1. The bottom panel shows the quantitative results. All the quantitative values were calculated at least in five distinct fields of each chamber. The data are expressed as a relative percentage to the controls. The statistic results were analyzed by t-test, *P<0.05, **P<0.01, ***P<0.001. Error bars represent the standard deviation (SD) of the mean from three independent experiments.

