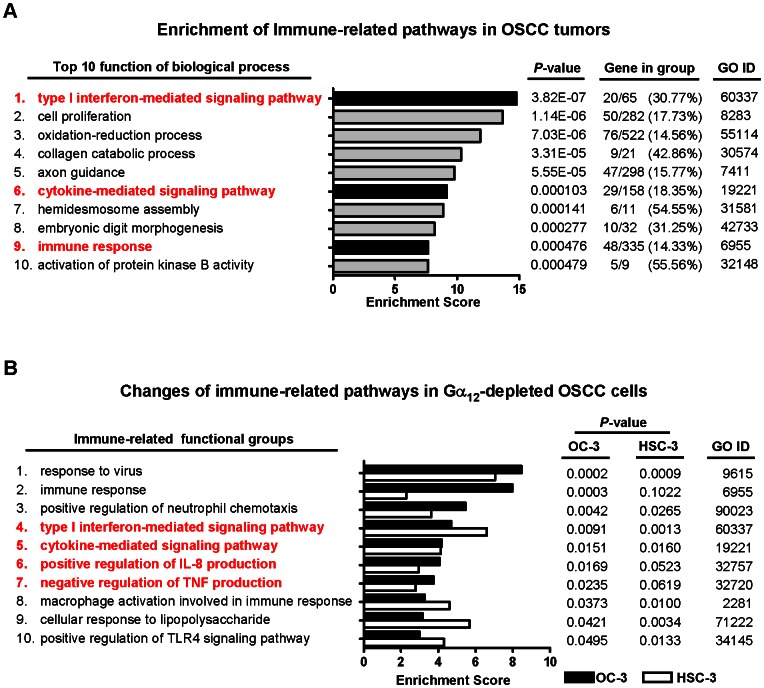
Figure 3. Transcriptome analysis reveals changes of immune-related pathways in OSCC and in Gα12-depleted OSCC cell lines.
(A) Comparative transcriptome analysis of OSCC tumors reveals that cytokine and other immune-related functional groups are listed in the top ten GO terms. A total of 1,616 differently expressed genes selected by 1.5 fold change cut-off (positive false discovery rate q<10−8) in 55 OSCC tumors compared to 21 normal control tissues were analyzed by GO and pathway analysis tools. Functional groups of the inflammation-related pathways are highlight in red. (B) The immune-related signaling pathways are significantly impaired in the Gα12-depleted OC-3 and HSC-3 cell lines. An arbitrary 2.0 fold-change cut-off is used to filter the differentially expressed genes compared between Gα12-depleted and non-targeted siRNA control cells for the GO enrichment analysis. A total of 58 genes for HSC-3 cells and 218 genes for OC-3 cells were subjected to the analysis. The cytokine and interferon-mediated pathways (highlighted in red) were found in the GO terms for both cell lines. Detailed information of the GO terms is shown in Table S1.

