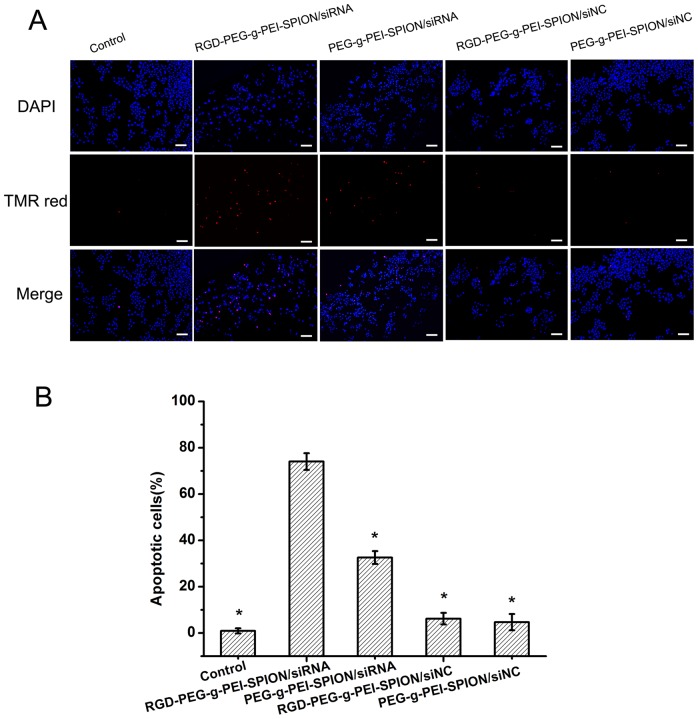
Figure 4. The apoptotic response to different treatments in Bel-7402 cells.
(A) Images show Bel-7402 cells incubated with: RGD-PEG-g-PEI-SPION/siRNA, PEG-g-PEI-SPION/siRNA, RGD-PEG-g-PEI-SPION/siNC or PEG-g-PEI-SPION/siNC (×200; scale bar:100 µm) (B) Percentage of apoptotic cells induced by various complexes at N/P ratio of 10 as quantified by TUNEL analysis (means±SD; n = 3; *p<0.05, compared with RGD-PEG-g-PEI-SPION/siRNA; Control: the cells without transfection).

