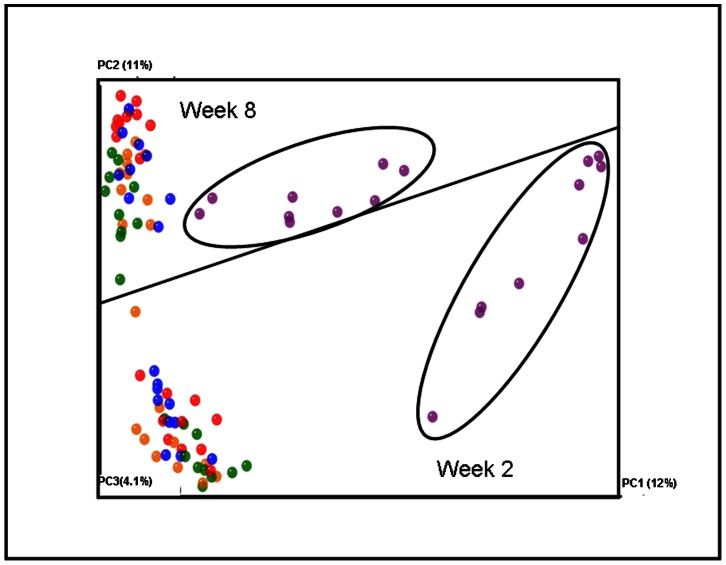
Figure 6. Principal coordinate analysis of unweighted unifrac reveals temporal shift.
Vancomycin treated diet induced obese mice (purple) cluster away from other groups at both time points, however the distance between these mice and other treatment groups at week 8 is less than at week 2. Data sets: purple vancomycin, blue lean, red DIO, green Bac+ and orange Bac-.

