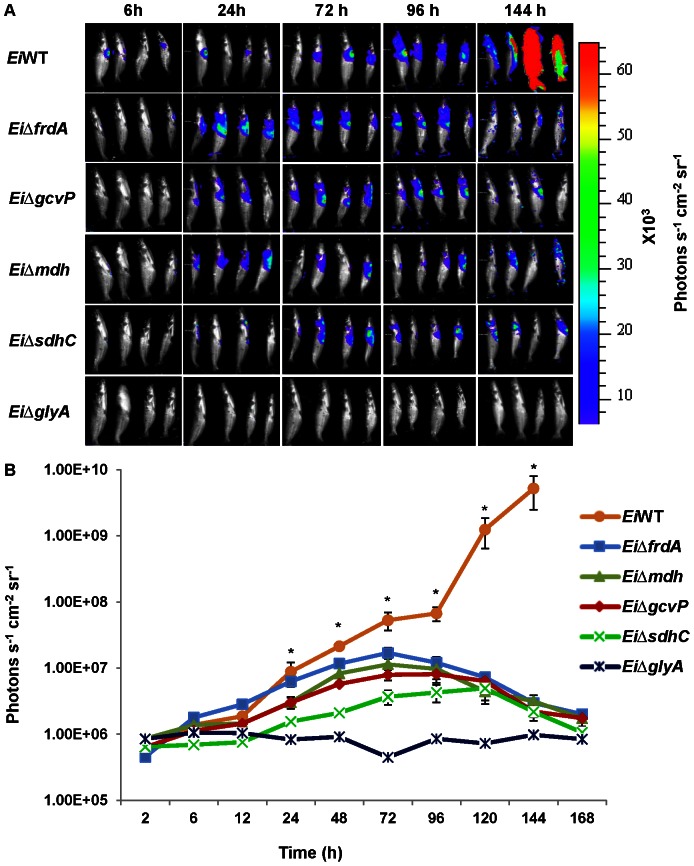
Figure 2. Bioluminescent imaging of vaccination/attenuation in live catfish after intraperitoneal injection.
A, BLI imaging of catfish. B, Total photon emissions from each fish. Each data point represents the mean photon emissions from four fish. Two of the four channel catfish injected with wild type died at 144 h post-infection. The remaining two died at 168 h post-infection. Star indicates significant difference between wild type E. ictaluri and other mutants, except for EiΔfrdA at 24 h.

