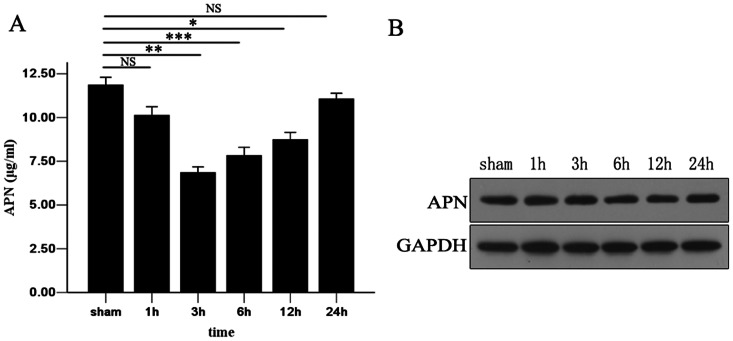
Figure 1. Dynamic change of serum APN concentration after liver I/R.
(A) Serum APN concentration at 1h, 3h, 6h, 12h, and 24h after reperfusion were assessed by ELISA. (B) Expression of APN in liver samples was measured using Western blotting. All data were obtained from at least three independent experiments and are shown as the means ± S.D., *P<0.05, **P<0.01, ***P<0.001.

