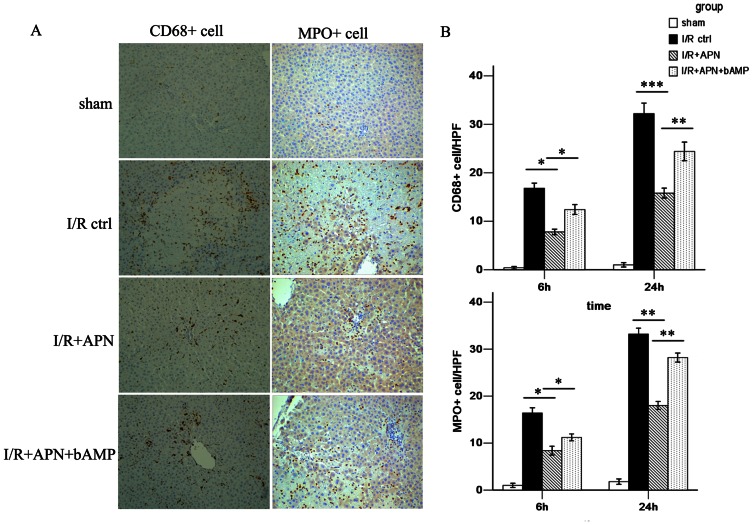
Figure 3. APN inhibits macrophage and neutrophil infiltration.
(A) Representative immunohistochemical staining showing CD68+ macrophages and MPO+ neutrophils in the sham group, I/R control group, I/R+APN group and I/R+APN+bAMP group at 24h after reperfusion. (B) Quantitative analysis of CD68+ macrophages and MPO+ neutrophils per high power field (HPF) in each experimental group.

