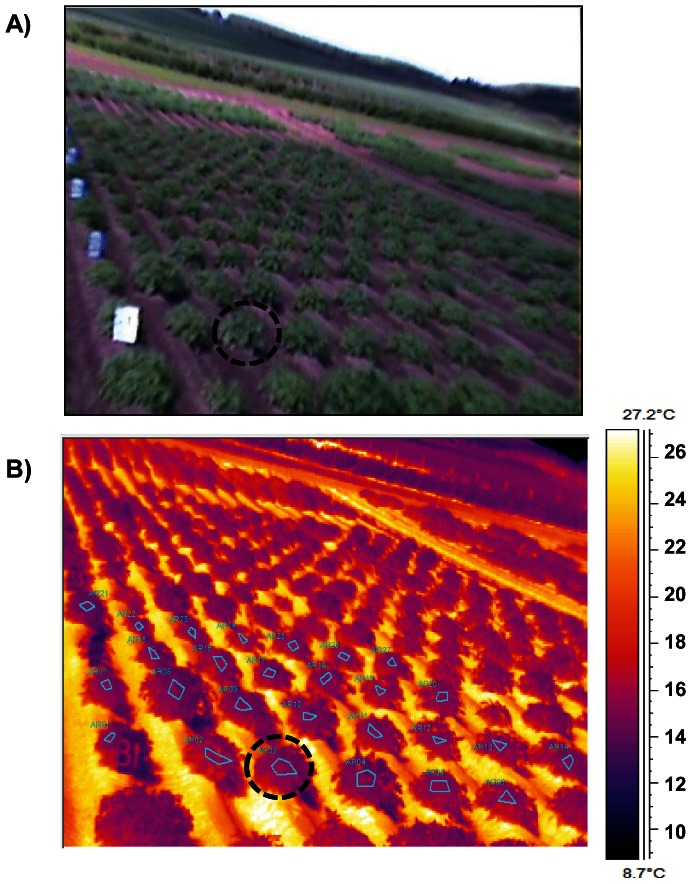
Figure 2. Visual (RGB) image and corresponding thermal image of part of the potato field trial.
A): Visual image of the randomised potato field trial showing markers to aid localisation in the thermal image. The marked circle indicates one of the two-plant plots. B) Corresponding thermal image; this shows the selected area of canopy for each plot isolated in the ThermaCAM Researcher Pro software.

