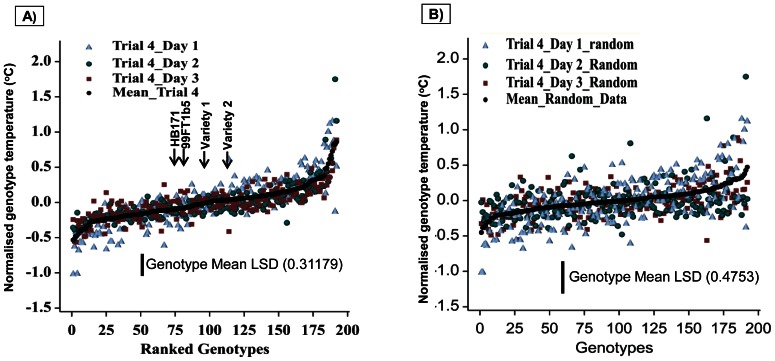
Figure 5. Variation of the normalised temperature for each genotype ranked by mean temperature.
A) Graphical representation of the consistency of the rankings of the different genotypes across three measurement dates for Trial 4. The genotypes are ranked along the x-axis according to the mean of all the replicate normalised genotype temperatures (°C) over three days. The X-axis also indicates the positions for the two parents (HB171, 99FT1b5) and two commercial varieties (Var1 = Record and Var2 = Cara). B) The same data as (A) but with data randomly assigned to ‘genotypes’ independently on each day, indicating the range of genotype means that could have arisen by chance. This confirms that the substantial genotypic differences in mean normalised temperature shown in (A) are not due to chance. LSD values presented at 95% level in all graphs.

