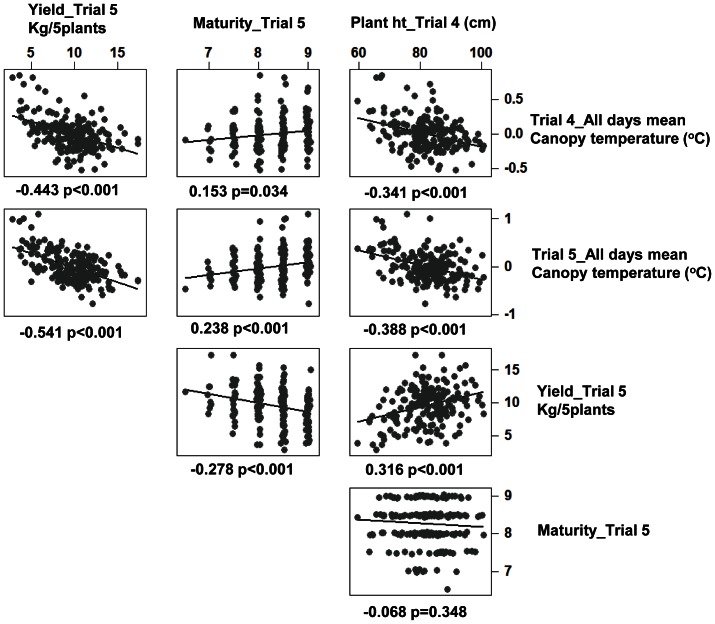
Figure 8. Genotype temperatures and harvest traits.
Relationship between normalised genotype temperatures (mean of three days) for Trials 4 and 5 and harvest traits (Yield, Plant height and Maturity) represented using regression lines in the plots. The numerical figures displayed provide the correlation coefficients and the p values for the plotted traits.

