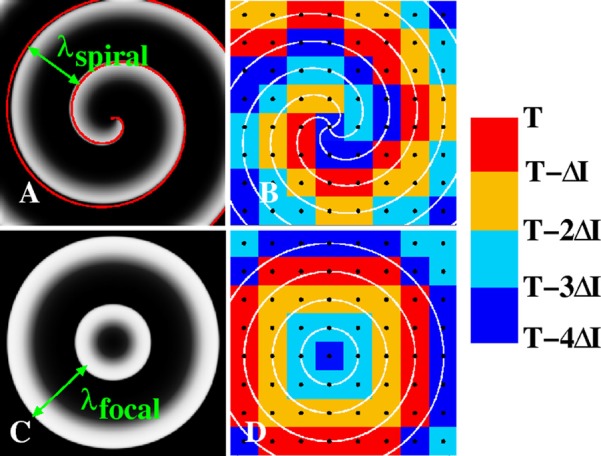
Figure 1.

(A) Computer simulation of a spiral wave using the Fenton-Karma model (parameter set #1 from Ref. 24). Activation is plotted in all figures using a gray scale with white corresponding to depolarized tissue and black corresponding to repolarized tissue. The wavelength λspiral of the rotor indicates the spatial scale between successive arms of the spiral. The red curve is an Archimedean spiral with its wavelength adjusted such that it fits the activation front of the simulated spiral. (B) Isochrones of a rigidly rotating Archimedean spiral with a period τ and separated by τ/4 (white lines) and a square grid of electrodes with spatial discretization Δx (black dots). The wavelength of the spiral is λspiral = 4Δx and the corresponding spatially continuous isochronal regions at time t = T are shown using the indicated colorscheme and time interval ΔI = τ/4. For larger spatial resolution, the isochronal regions are no longer spatially continuous. (C) Computer simulation of a focal source with a wavelength λfocal and period τ using the same gray scale and parameter set as in (A). (D) Isochronal map of the focal beat of (C), along with isochrones separated by τ/4 (white lines), computed from a square grid with resolution Δx.
