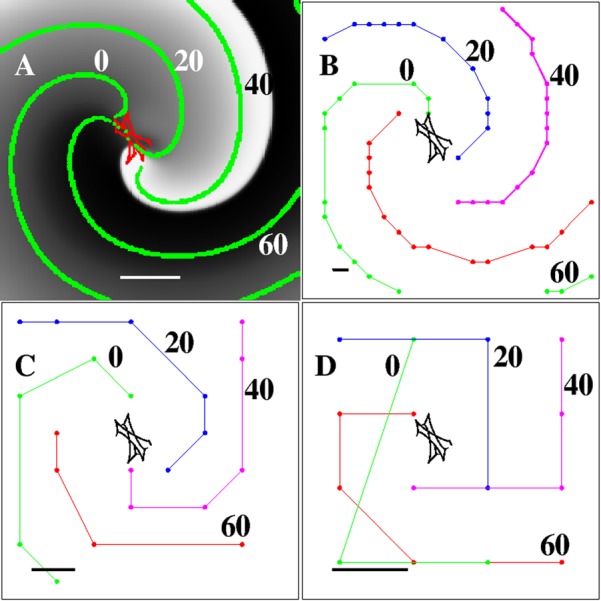
Figure 2.

Computer simulation of a single-armed rotor spanning the entire field of view. (A) Snapshot of the activation (t = 45 ms) of a clock-wise rotating rotor simulated on a 200 × 200 grid, corresponding to a 5 × 5 cm domain. The activation is plotted using a gray scale while the meandering spiral tip of the rotor is shown in red. The green symbols are isochrones, 20 ms apart, superimposed onto the snapshots. Scalebar = 1 cm. (B) Isochrones computed on a 20 × 20 grid that was obtained by spatially coarsening the original 200 × 200 grid. Isochrones are again 20 ms apart and the scalebar represents the spatial resolution (Δx = 2.5 mm). (C) Same as (B) but now using an 8 × 8 grid and a spatial resolution of Δx = 6.25 mm. (D) Same as (B) and (C), using a 4 × 4 grid and a spatial resolution of Δx = 12.5 mm. This illustrative reentry pattern was generated using the FK model of Ref. 42.
