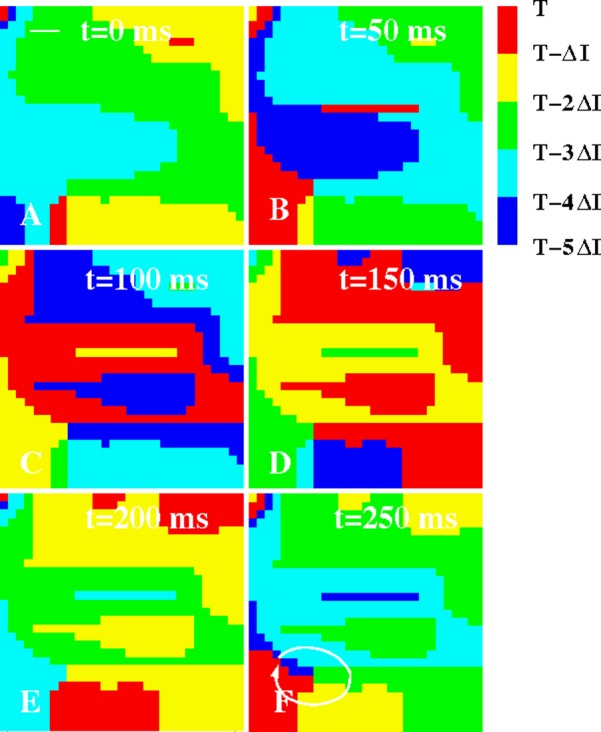
Figure 7.

Isochronal maps of the LA of a patient with paroxysmal AF (ΔI = 50 ms). A rotor is visible in the low LA, visualized by the white line in (F), with more complex dynamics in the upper portion of the LA. The white bar in (A) represents the interelectrode spacing.
