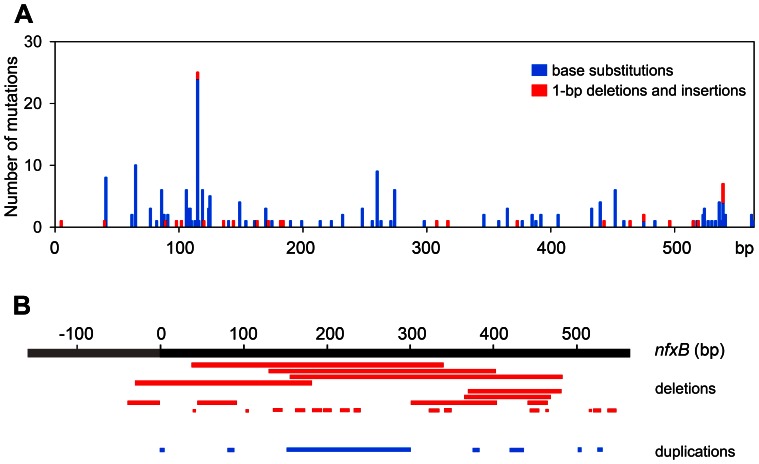
Figure 1. Distribution of mutations in nfxB.
The position of all mutations detected in nfxB among 240 Cipr clones derived independently from different genetic backgrounds or treatment with mutagens is plotted. (A) The number of base substitutions (blue bars) and 1-bp deletions and insertions (red bars) detected at each nucleotide position of the open reading frame is shown. (B) >1-bp deletions (red bars) and duplications (blue bars) are displayed over the open reading frame (black bar) and promoter region (grey bar) of nfxB.

