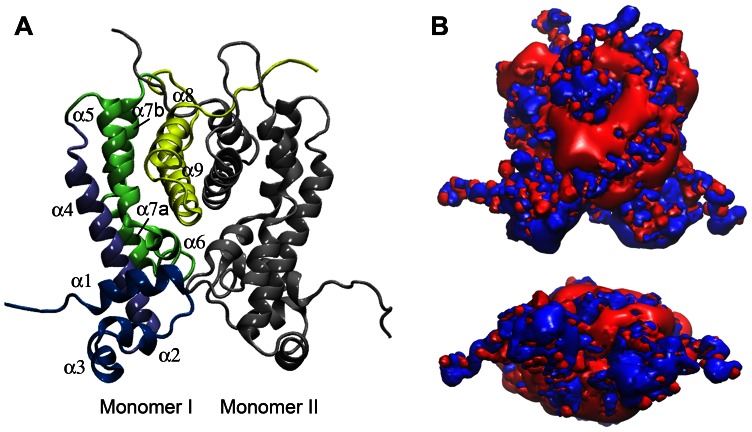
Figure 2. 3D-structural model of NfxB.
(A) Ribbon representation of the homology-modeled NfxB dimer based on the TetR-like transcriptional repressor LfrR. Helices α1–α3 are shown in blue, α4 in light blue, α5–α7b in green, and α8 and α9 are in yellow. N-terminal helices α1 to α3 and C-terminal helices α8 and α9 corresponded to LfrR helices involved in DNA-binding and dimerization, respectively. (B) Front (above) and top-down (below) visualization of electrostatic potential distribution in the NfxB dimer as determined using APBS. Positive and negative potentials are indicated in blue and red, respectively. Note that a large positive charged surface is located on the N-terminal loop between helices α1 and α2 and helices α2 and α3, which could form the putative DNA-binding channel in the NfxB dimer.

