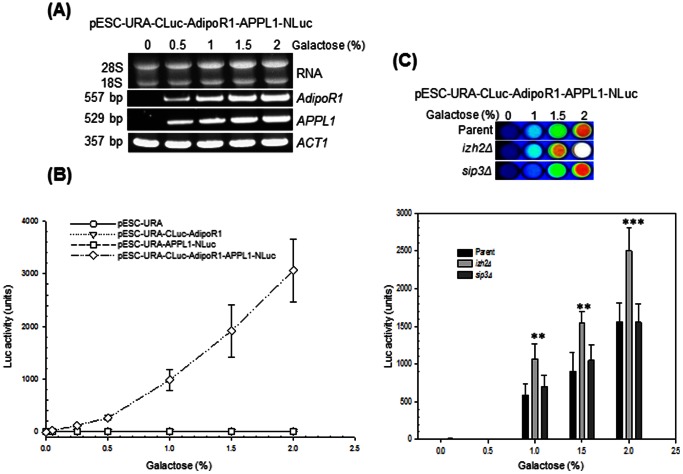
Figure 4. Luciferase reporter activity depends on the expression level of AdipoR1 and APPL1.
(A) RT-PCR analysis of AdipoR1 and APPL1 expression in total RNA (2 µg) from cells of strain BY4741 carrying pESC-URA-CLuc-AdipoR1-APPL1-NLuc that were grown for 16 h at 30°C in selective minimal medium at the indicated galactose concentrations. The final concentration of sugars in the growth media was adjusted to 2% with raffinose. ACT1 expression is shown for normalization. (B) Quantification of luciferase activity in BY4741 cells carrying pESC-URA, pESC-URA-CLuc-AdipoR1, pESC-URA-APPL1-NLuc and pESC-URA-CLuc-AdipoR1-APPL1-NLuc plasmids. Cells were grown for 16 h at 30°C in selective minimal medium at the indicated galactose concentrations. Luciferase activity measurements were made as described in Methods. (C) Imaging (top) and quantification of luciferase activity (bottom) in pESC-URA-CLuc-AdipoR1-APPL1-NLuc transformants of strain BY4741 (Parent) or its isogenic izh2Δ and sip3Δ derivative strains. Assays were performed as described above on cells that were grown for 16 h at 30°C in selective minimal medium at the indicated galactose concentrations. Results are expressed as the mean ± SD from three separate experiments with triplicate samples. Significant difference from the parent strain is indicated by asterisks. Symbols: **, p<0.01; ***, p<0.001.

