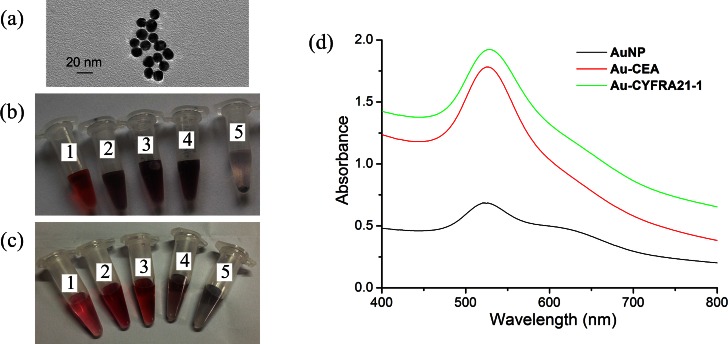
Figure 4.
(a) Photograph of 13-nm AuNPs shown at the transmission electron microscopy image. (b) Image of the color change at AuNPs labeled with CEA antibody, the final concentration of antibody and NaCl in five tube (No. 1: 5 μg/ml CEA, 2 mM NaCl; No. 2: 10 μg/ml CEA, 2.5 mM NaCl; No. 3: 20 μg/ml CEA, 3 mM NaCl; No. 4: 30 μg/ml CEA, 3.5 mM NaCl; No. 5: 40 μg/ml CEA, 4 mM NaCl). (c) Image of the color change at AuNPs labeled with CYFRA21-1 antibody, the final concentration of antibody and NaCl in five tube (No. 1: 30 μg/ml CYF21-1, 3 mM NaCl; No. 2: 40 μg/ml CYF21-1, 3.5 mM NaCl; No. 3:50 μg/μl CYF21-1, 4 mM NaCl; No. 4:55 μg/ml CYF21-1, 4.5 mM NaCl; No. 5:60 μg/ml CYF21-1, 5 mM NaCl). (d) UV-Vis spectra of AuNPs solution and coating with antibody.

