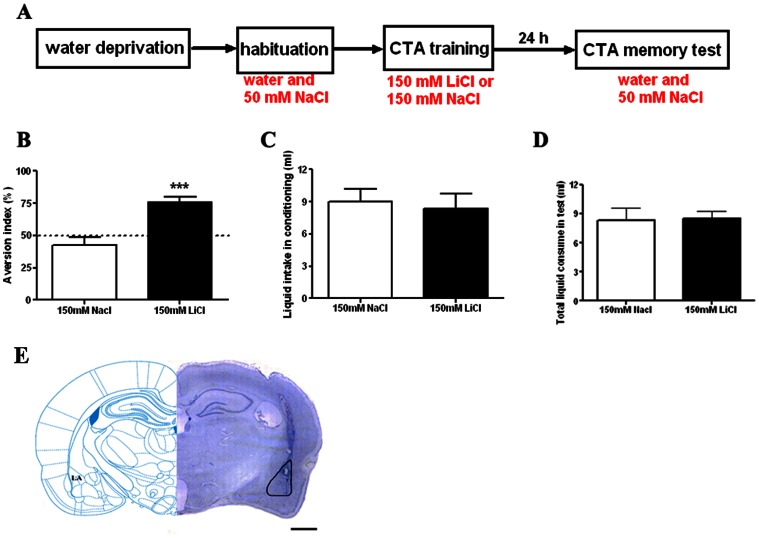
Figure 2. CTA paradigm used in the experiment.
A, Illustration of the experimental procedures to generate CTA in rats. B, Summarized bar graph showing that rats acquires long-term taste aversion (24 h) to salty solution after drinking of LiCl, but not the NaCl. The LiCl group rats shows significantly higher aversion index (AI) than the control NaCl group during memory test, meaning good CTA memory. C, Summarized bar graph showing that the total liquid intake during conditioning was similar in LiCl and the control NaCl groups. D, A column graph showing that the total liquid consumption during test was similar in LiCl and the control NaCl groups. E, Representative photomicrographs illustrating placement of cannula and needle tip in the lateral amygdala. Line bar indicates 1 mm. ***p<0.001, n = 8 per group. Error bars indicate SEM.

