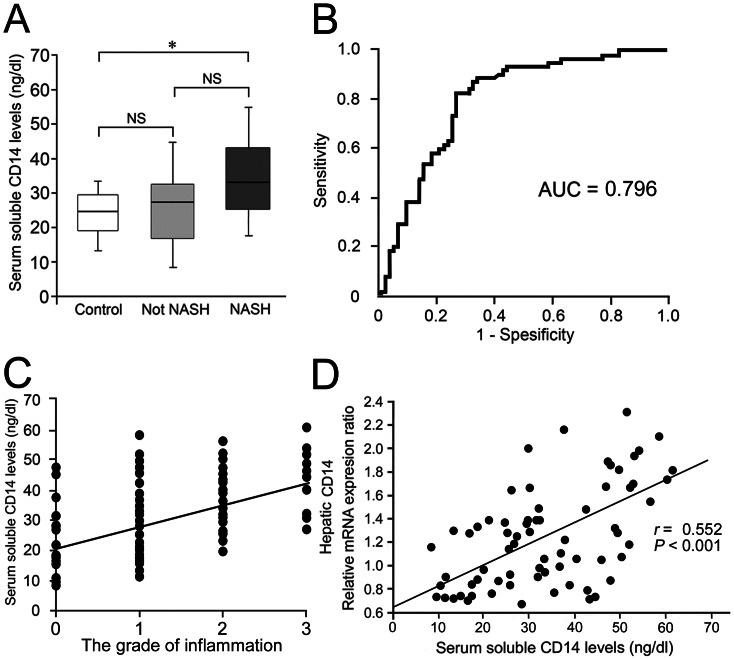
Figure 1. Serum sCD14 levels, liver inflammation and hepatic CD14 expression.
(A) Serum sCD14 levels in control subjects and patients with NAFLD. The graph shows the interquartile range (box), median (the line), and range (lines) of serum sCD14 levels. The median (range) values (ng/dl) are 24.3 (13.3–32.4), 27.5 (9.21–44.2), and 32.2 (17.9–54.2) for control subjects (n = 21), not NASH (n = 48), and NASH (n = 65), respectively. Statistical significance was determined by analysis of variance with Scheffe’s correction for multiple testing. *P<0.05. (B) Receiver operating characteristic (ROC) curve and area under the ROC curve (AUROC) for distinguishing between not NASH (n = 48) including control subjects (n = 21) and NASH (n = 65) using serum sCD14 level. (C) Relationship between serum sCD14 and the grade of liver inflammation in patients with NAFLD. Serum sCD14 levels are significantly correlated with the grade of liver inflammation (Spearman’s r = 0.498, P<0.001). (D) Relationship between serum sCD14 and hepatic CD14 mRNA expression in patients with NAFLD. Serum sCD14 levels are significantly correlated with hepatic CD14 mRNA expression levels (Spearman’s r = 0.552, P<0.001). The correlation was determined in 69 patients with NAFLD patients.

