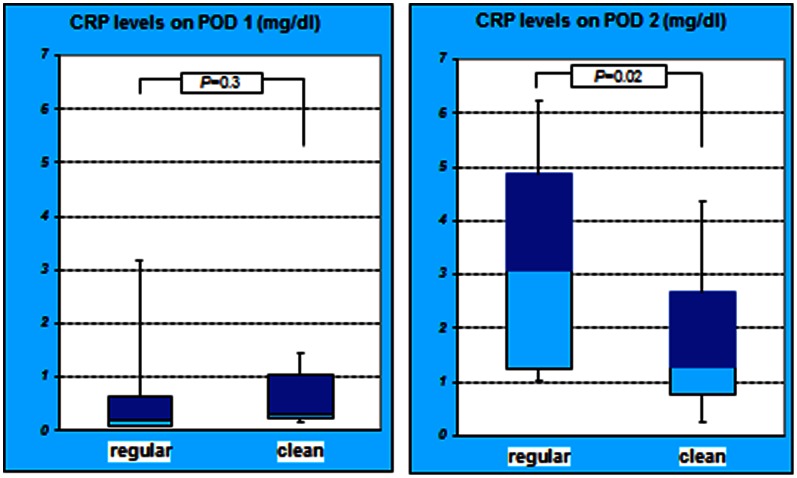
Figure 4. CRP level of both groups on POD 1 and 2.
The difference in the CRP levels on POD 1 was not significant between the 2 groups (P = 0.3). However, on POD 2, the difference in the CRP levels was significant (P = 0.02). The CRP level in the regular group on POD 2 was higher compared to clean group.

