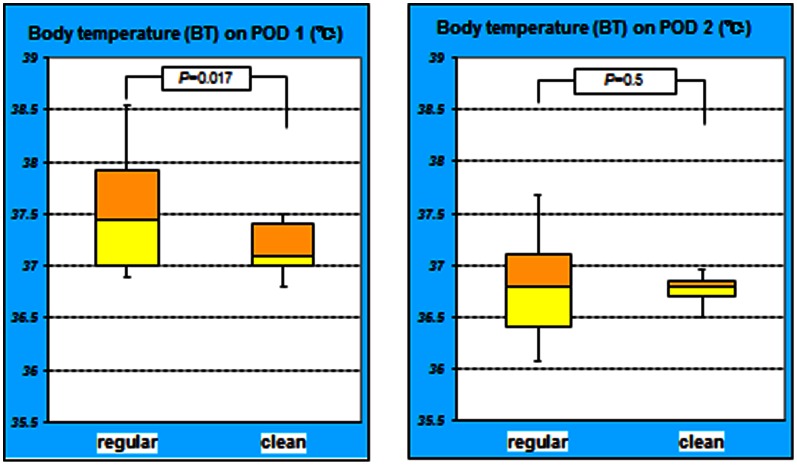
Figure 5. Time-dependent changes in body temperature of both groups.
The difference in patient’s BT on POD 1 was significant between the groups (P = 0.017). However, on POD 2, the BT did not significantly differ between the groups (P = 0.5). The BT in the regular group on POD 1 was higher compared to clean group.

