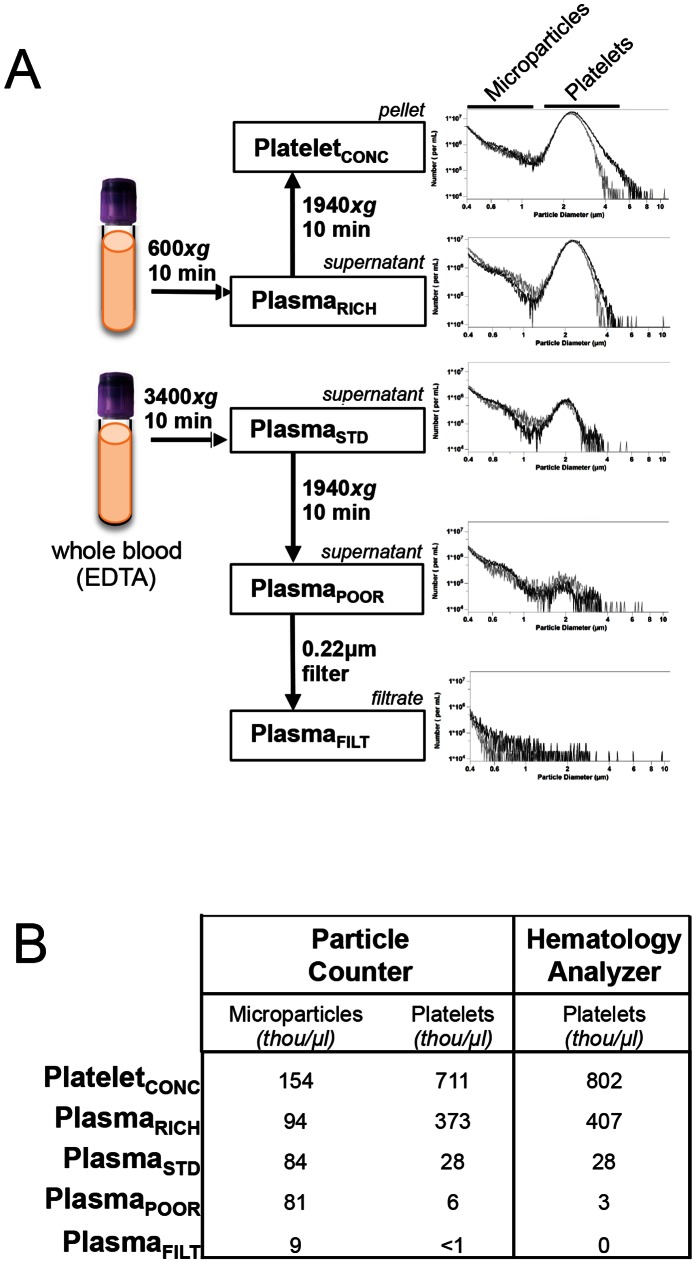
Figure 2. Stepwise Plasma Processing and Associated Particle Content.
(A) Left: Schematic of stepwise plasma processing steps. Right: Histogram content of platelets and microparticles in stepwise processed plasma samples. X-axis is particle diameter and Y-axis is number of particles/mL. (B) Platelet and microparticle content (in thousand/µL) of stepwise processed plasma samples as measured by particle counter and hematology analyzer.

