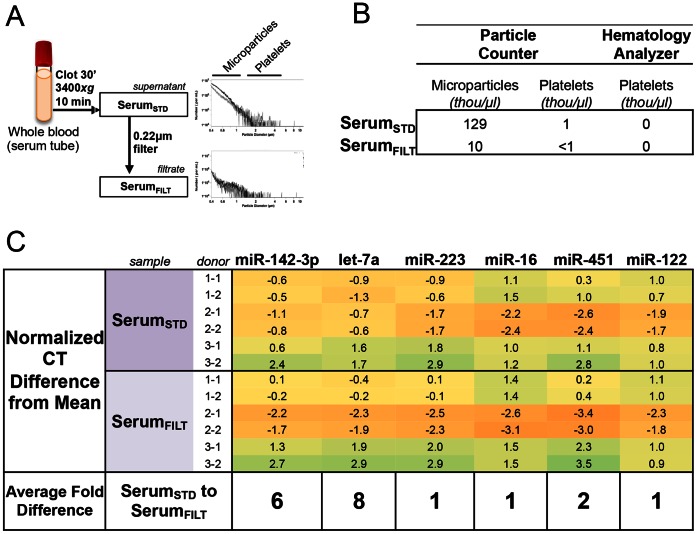
Figure 5. Serum Processing and Associated Particle Content.
(A) Left: Schematic of SerumSTD processed with a 0.22 um filtration step to form SerumFILT. Right: Histogram content of platelets and microparticles in stepwise processed plasma samples. X-axis is particle diameter and Y-axis is number of particles/mL. (B) Platelet and microparticle content (in thousand/µL) of serum samples as measured by particle counter and hematology analyzer. (B) Validation of selected miRNAs by individual qRT-PCR assay. Normalized CT difference from mean of all 7 samples (including 5 plasma samples) is shown. MicroRNAs are arranged as in Figure 3. Average fold difference between SerumSTD vs. SerumFILT is indicated below.

