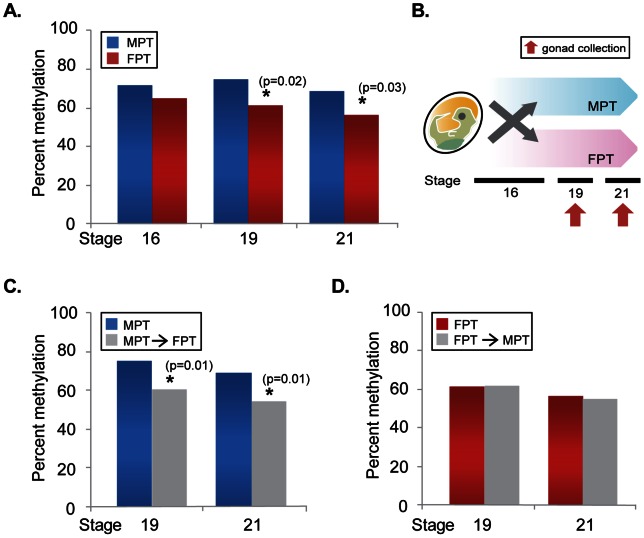
Figure 4. Total DNA methylation level of the putative aromatase promoter in the gonads.
Total percent DNA methylation during embryonic development at MPT and FPT (A), MPT shifted to FPT (C), and FPT shifted to MPT (D) were examined. (B) The scheme of temperature-shift experiment. Each bar represents twenty to twenty-two clones/stage/temperature from the data of a single pool of 10 gonads. Asterisk (*) is statistically significant (p<0.05) according to the Fisher's exact test. MPT: male-producing temperature. FPT: female-producing temperature.

