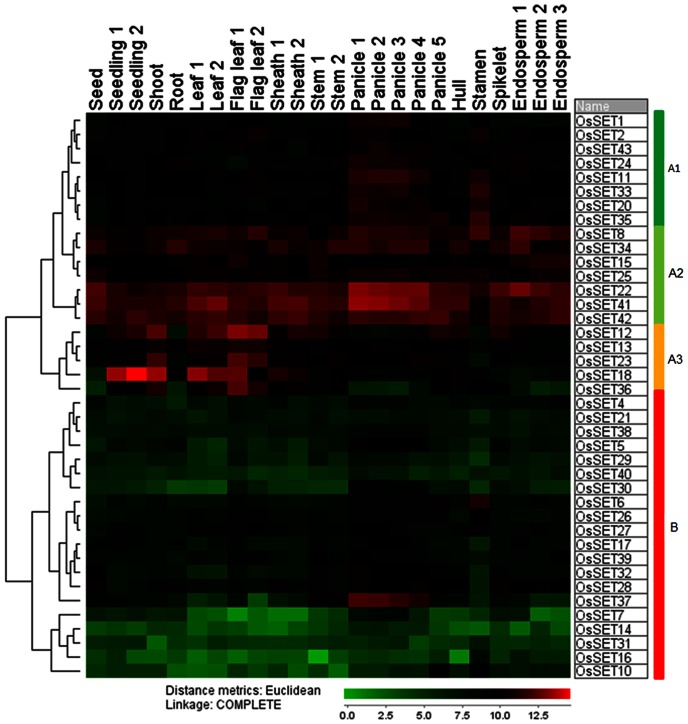
Figure 5. Expression patterns of OsSET genes during the life cycle of the rice plant.
Hierarchical cluster displays the expression profile for 40 OsSET genes with matching probesets in the Affymetrix microarray. (Color bar at the base represents log2 expression values: green, representing low expression; black, medium expression; red, high expression).

