
Figure 8. Differential expressions of OsSET genes in different stages in Minghui 63 based on microarray analysis.
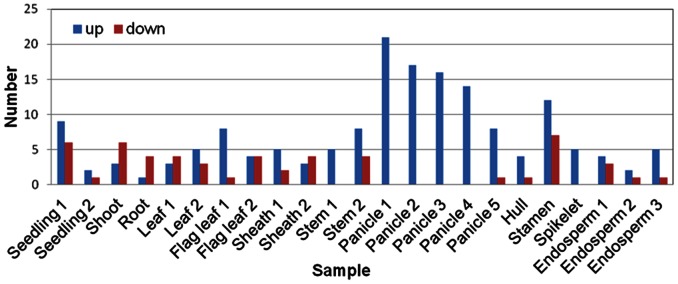
Differential expression genes have been taken p value less than 0.05 and fold change >2 or <0.5. When fold change >2, regulation is up, and when fold change <0.5, regulation is down.