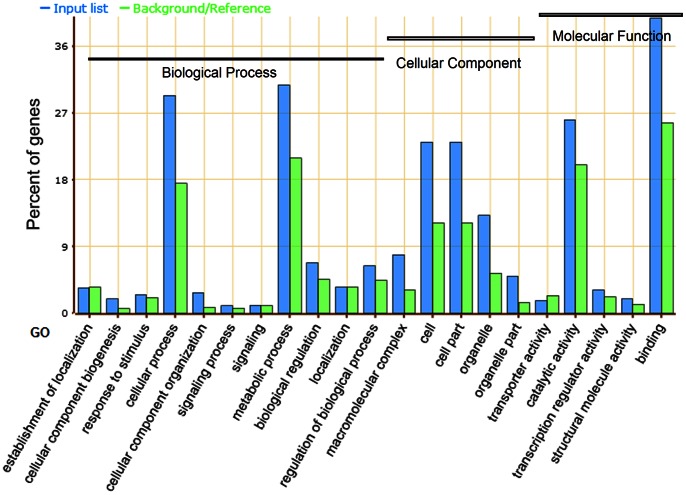
Figure 9. Enriched GO analysis of genes that co-expressed with OsSETs.
X-axis represents the GO annotation. Y-axis represents the percentage of GO annotation. Three categories of GO annotation are biological process, cellular component and molecular function. Input list represents genes analyzed, and the references/background represents all genes in agriGO database.

