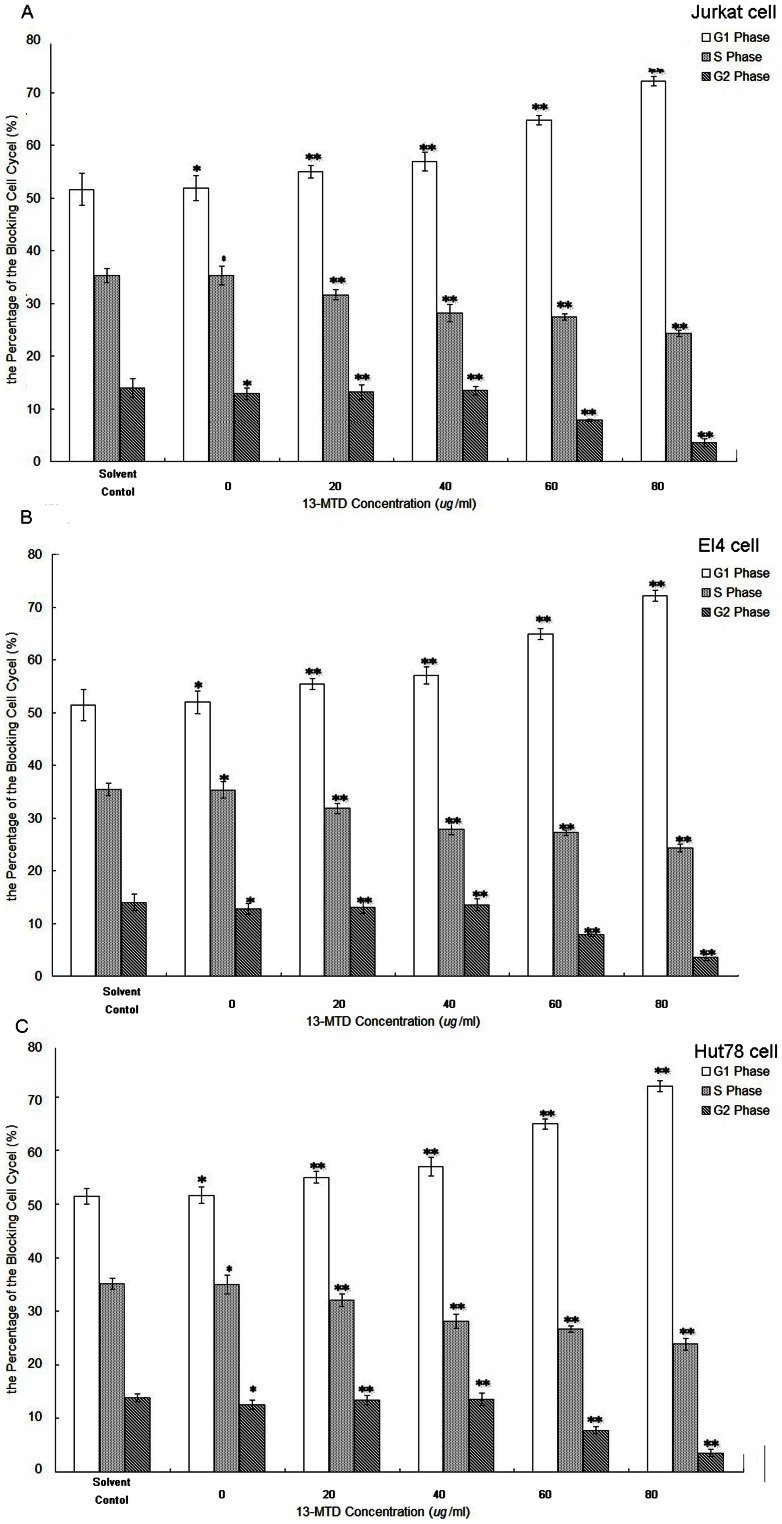
Figure 2. The effects of 13-MTD in the G1 phase arrest in T-NHL cells.
Cells at a density of 2 × 10⁶ cells per well were treated with 13-MTD at different concentrations (0, 20, 40, 60, 80 µg/ml) for 48 h and harvested to evaluate the cell cycle distribution. The percentage of cells in G1, S, and G2 phases in Jurkat (A), EL4 (B) and Hut78 (C) cells are shown. *P>0.05, ** P<0.05 compared with the solvent group. All data are derived from three individual experiments with triplicate wells.

