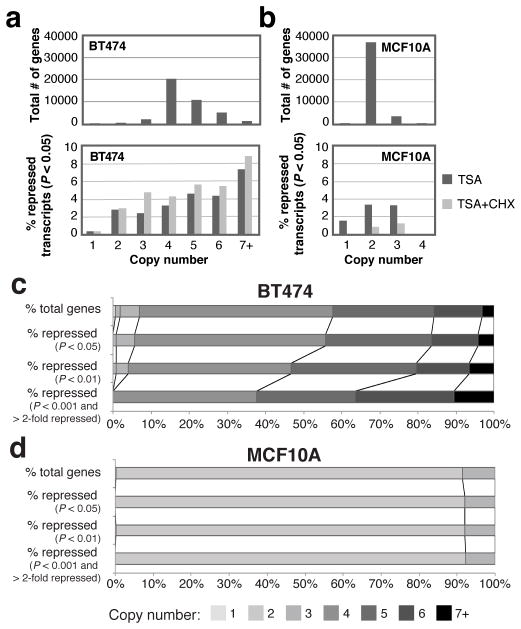
Figure 6.
Genome-wide changes in mRNA levels upon HDAC inhibition in relation to copy number. (a–b) Histogram distribution graphs of the number of genes for given copy numbers as determined by MixHMM (top), and the percent of genes of the indicated copy number that are significantly repressed (P < 0.05) after TSA (dark grey) or TSA with CHX (light grey) treatment (bottom) in BT474 and MCF10A. See also Supplementary Table 3 for statistics on (a) and (b). (c–d) Stacked histograms for MCF10A and BT474, respectively. The top stacked bar is the distribution of all genes having the indicated copy numbers, and the bars below are the percent of genes that are significantly repressed by TSA as determined at increasing statistical thresholds (log-likelihood ratio) and cutoffs for minimum magnitude of change for defining transcripts as ‘repressed,’ which are indicated to the left. Lighter colors represent lower copy numbers and darker colors represent higher copy numbers.

