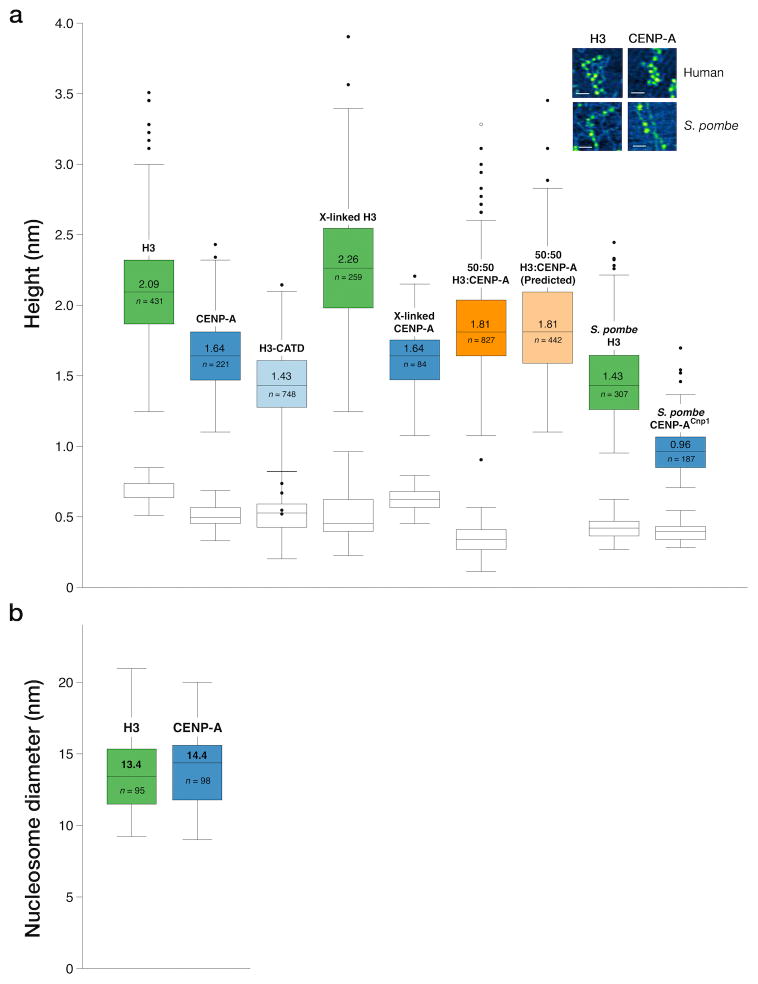
Figure 2. Octameric CENP-A nucleosomes are lower in height.
(a) Box plots of AFM peak heights for individual human and S. pombe H3 and CENP-ACnp1 nucleosomes, fixed nucleosomes and mixed nucleosomes. Naked DNA control for each image (white box plots). Inset (a): AFM image example, bar = 50 nm.
(b) Distribution of nucleosome diameters for 95 H3 and 98 CENP-A human particles. Box Plots: central lines with values = medians; box outer edges = first and third interquartile ranges; whiskers = range; outliers = single dots. n = particle number counted per sample.

