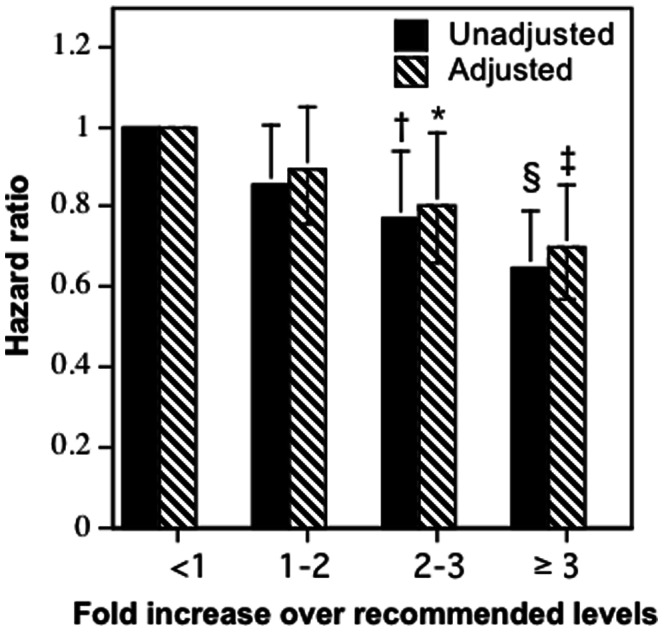
Figure 1. Reduction in the risks for incident cardiac arrhythmias per METhr/d for walking and running energy expenditure combined relative to the least active walkers and runners.

Adjustment for BMI and hypertension treatment had little effect on these risk reductions. Energy expenditure (X-axis) is categorized in terms of the upper limit of the minimum recommended physical activity levels (750 MET⋅min/wk = 1.8 METhr/d [10], [18]), e.g., 1 to 2-fold higher activity covers from 1.8 to 3.6 METhr/d, 2- to 3-fold covers from 1.6 to 3.4 METhr/d etc. Error bars represent 95% confidence intervals. Significant levels relative to <1.8 METhr/d coded: * P<0.05; † P<0.01, ‡ P<0.001, and ‡ P<0.0001. The superscript § means that the risk for runners who ran ≥3-fold was significantly less than those who ran <1-fold the recommended level.
