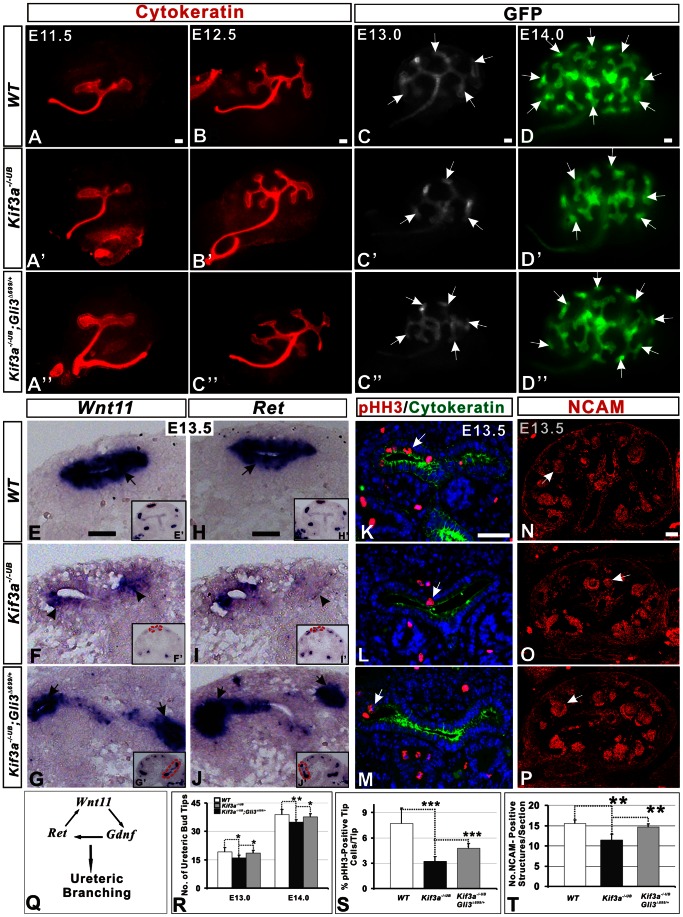
Figure 4. Kif3a controls renal branching morphogenesis in a GLI3R-dependent manner.
(A–C’’) Cytokeratin immunofluorescence demonstrating ureteric branching at E11.5 and E12.5. The branch pattern is similar among WT (A,B), Kif3a−/−UB (A’,B’) and Kif3a−/−UB;Kif3aΔ699/+(constitutive expression of Gli3Δ699/+ in Kif3a−/−UB background, A’’, B’’) kidneys. (C–D’’) Ureteric branching in WT, Kif3a−/−UB, and Kif3a−/−UB;Gli3Δ699/+mice at E13.0 and E14.0. In Hoxb7-GFP-Cre mice, GFP expression in the kidney is restricted to the ureteric cell lineage. Ureteric branches expressing GFP are visualized in whole mount preparations of kidney explants generated from E13.0 (C, C’ and C’’) and E14.0 (D, D’ and D’’). Imaging suggests that branch number in Kif3a−/−UB mice (C’, D’) is less than that in WT (C, D) and Kif3a−/−UB;Gli3Δ699/+mice (C’’, D’’). (E–J) Wnt11 and Ret expression. In WT kidney, Wnt11 (E) and Ret (H) are strongly expressed in ureteric tip cells (arrows). Expression of Wnt11 (F) and Ret (I) is markedly decreased in Kif3a−/−UB mice. In Kif3a−/−UB;Gli3Δ699/+ mice, Wnt11 (G) and Ret (J) expression are rescued to levels similar to that observed in WT mice. (K–M) Phosho-Histone H3 (pHH3) is stained in mitotic cell of ureteric tip (red color) that is marked by cytokeratin (green color) at E13.5. (N–P) NCAM staining showing nephrogenic structures at E13.5. Decreased formation of NCAM-positive structures in Kif3a−/−UB mice (O versus N) is rescued in Kif3a−/−UB;Gli3Δ699/+ (P versus O) mice (Q) Schematic showing the Wnt11/Gdnf/Ret gene network that promotes ureteric branching morphogenesis. (R) Quantitation of ureteric branch tip number reveals a significant decrease in Kif3a−/−UB mice compared to WT at E13.0 and E14.0 but increased branching in Kif3a−/−UB;Gli3Δ699/+ mice compared to Kif3a−/−UB mice. (S) Quantitation of mitotic tip cells in K, L and M. pHH3 marked cells are decreased in Kif3a−/−UB mice (L) compared to WT (K). pHH3-positive cells is remarkably increased in in Kif3a−/−UB;Gli3Δ699/+ mice compared to Kif3a−/−UB mice (M versus L). (T) Quantitation of NCAM-positive structures in N, O and P reveals a significant decrease in Kif3a−/−UB mice compared to WT and Kif3a−/−UB;Gli3Δ699/+ mice. (*, P<0.05, **, P<0.01, *** P<0.001). Scale bars: 50 micrometer.

