
Figure 1. Average time-activity curves for [18F]FDG (a) and [18F]FECT (b), expressing uptake in the cerebral cortex (○), caudate-putamen (□) and cerebellum (Δ).
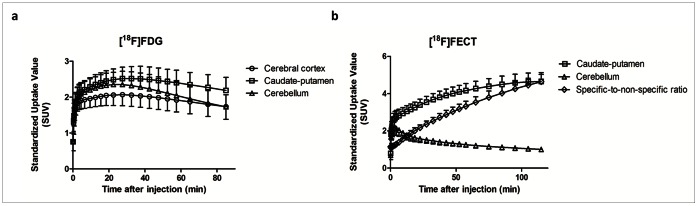
For [18F]FECT, specific-to-non-specific ratio (caudate-putamen to cerebellum (◊)) is also shown.