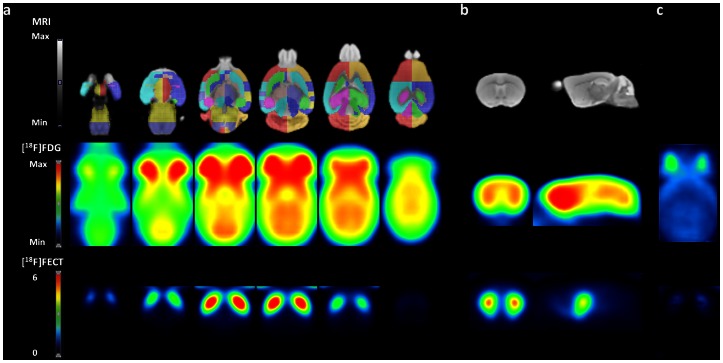
Figure 4. [18F]FDG and [18F]FECT probabilistic atlases.
(a) Series of axial sections (ventral to dorsal, slice interval 1.2 mm, radiological orientated) through the mouse brain MRM atlas (top row) and co-registered [18F]FDG (middle row) and [18F]FECT (bottom row) small-animal PET template. (b) One representative coronal (radiological orientation) and sagittal slice through caudate-putamen. (c) Horizontal section through variance map at level z = −2.8 (relative to bregma). The mouse brain MRM atlas shows the pre-defined VOI map over-layed. Color bars indicate relative intensities for [18F]FDG; binding potential for [18F]FECT.

