
Figure 5. (a) Representative fit of the cortical [18F]FDG time-activity-curve using a 3-compartment model (dashed line) and liver input function (solid line).
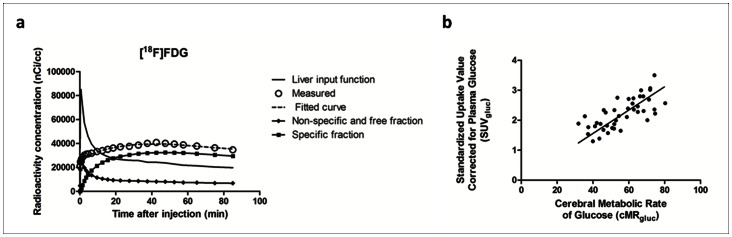
(b) Comparison of regional values of cMRglc derived from a 3-compartment model fit to SUVglc measured between 45 min and 60 min post injection. Solid line linear regression; spearman r = 0.73; p<0.0001.