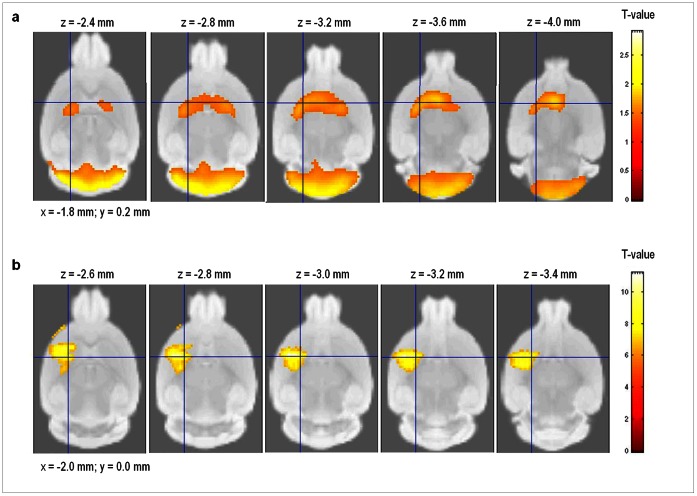
Figure 6. Statistical parametric maps of 6-OHDA mice.
Differences for the brain-regions have been color-coded and are superimposed on the MRM template. Series of axial sections with t-maps rendered on the MRM atlas of the mouse brain show significant reductions in glucose metabolism (a) and DAT availability (b). The colored bars on the right express T-score levels. The intersection points of the axial planes have been set to the position of the right caudate-putamen, i.e. (x,y) = (−1.8, 0.2) and (x,y) = (−2.0, 0.0) for [18F]FDG and [18F]FECT, respectively. Images are in radiological convention.

