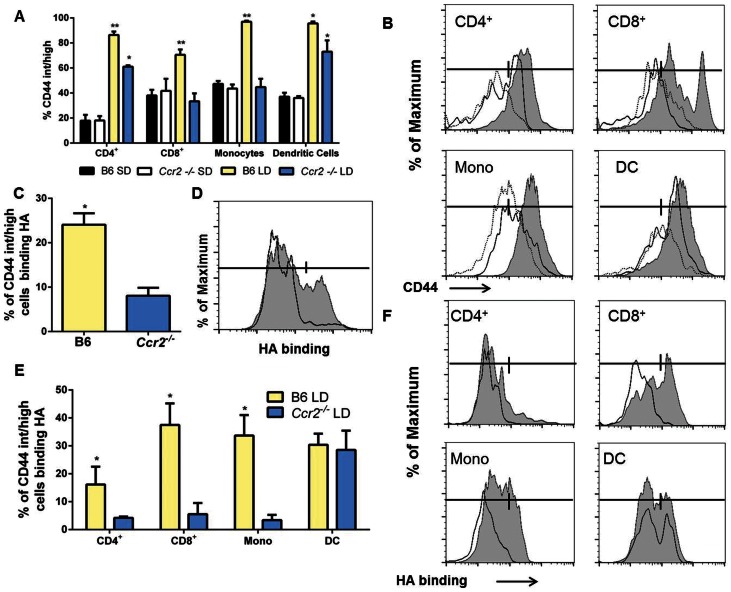
Figure 10. CCR2 deletion reduces HA binding and CD44 expression in T-cells and monocytes.
(A) Binding of HA by liver leukocytes of LD fed B6 and Ccr2−/− mice. (A) Proportion of hepatic CD44int/hi cells in SD and LD fed B6 and Ccr2−/− mice. LD fed B6 mice show significant increases in CD44int/hi CD8+ cells, CD4+ cells, monocytes and dendritic cells when compared to SD fed control mice and significant increases in CD8+ cells, CD4+ cells, and monocytes when compared to LD fed Ccr2−/− mice (*:P<0.05 compared to SD fed group, **:P<0.05 compared to all groups). (B): Histograms showing CD44 expression in CD4+ cells, CD8+ cells, monocytes and dendritic cells from LD fed B6 mice (gray shaded region), LD fed Ccr2−/−mice (solid line) or SD fed B6 mice (dashed line) demonstrating an increase in CD44 expression in LD fed B6 mice compared to LD fed Ccr2−/− mice in all cells with the exception of dendritic cells. Bars represent gates for CD44int/hi cells. (C) Binding of HA by CD44 int/hi liver leukocytes of LD fed B6 and Ccr2−/− mice demonstrating increased HA binding in CD44int/hi populations (*:P<0.05). (D) Representative histogram showing HA binding by CD44 int/hi liver leukocytes from B6 (shaded) and Ccr2−/− (solid-line) mice. Bar represents gate used for positive and negative staining. (E) Percentage of HA binding of various CD44int/hi leukocyte populations demonstrating significant increases in the binding of CD4+ cells, CD8+ cells and monocytes in B6 LD mice compared to Ccr2−/− LD mice. Both groups exhibited a high degree of HA positive binding in dendritic cells (*:P<0.05). Representative histograms showing HA binding by various populations of CD44 int/hi liver leukocytes from B6 (shaded) and Ccr2−/− (solid-line) mice. Bar represents gate used for positive and negative staining for each cell type. For individual cell-types gating was determined by the background HA staining of a non-target group of CD44−/low expressing cells.

