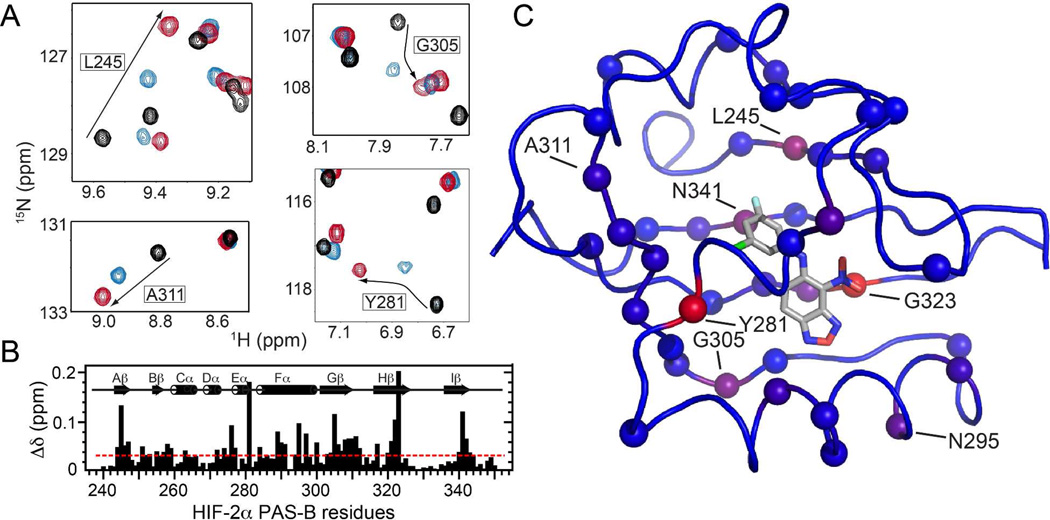
Figure 5.
Solution NMR characterization of the 23 and 32 complexes with HIF-2α PAS-B. A) 15N/1H HSQC spectra of apo HIF-2α PAS-B (black) and its complexes with 23 (blue) and 32 (red) reveal sites differentially perturbed by the two analogs. B) Chemical shift differences in HIF-2α PAS-B observed between the complexes (with ligands 23 and 32) are plotted along the protein sequence. The red line at 0.033 ppm denotes the average difference observed across all sites. C) Chemical shift differences mapped onto the HIF-2α PAS-B – 32 complex structure (PDB code: 4GHI) as a blue to red gradient, with spheres marking sites experiencing a greater than average difference.

