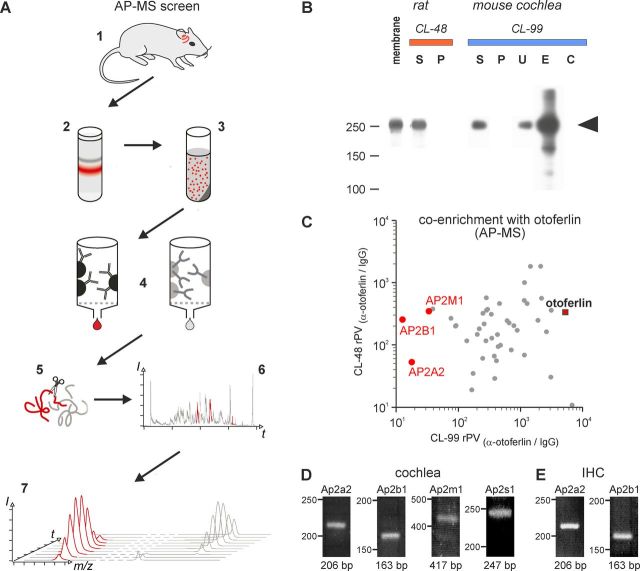
Figure 1.
AC-MS screen of otoferlin-associated proteins in rat and mouse cochlea. A, Illustration of the AP-MS workflow starting with collection of rat/mouse cochleae (1), membrane preparation (2) and solubilization (3), affinity purification (4), tryptic digest (5), LC-MS/MS analysis (6), and integration of m/z signals over time (PVs; 7) for quantitative evaluation; red color indicates the presence of otoferlin. B, Western blot resolving aliquots of rat and mouse cochlea membrane, soluble (S) and nonsoluble (P) fractions obtained with the indicated detergent buffers during solubilization, as well as unbound proteins (U) and eluates after AC with immobilized anti-otoferlin (E) and control IgG (C), respectively. Ten percent SDS-PAGE transferred to PVDF membrane, stained with anti-otoferlin/anti-rabbit-horseradish peroxidase and developed with ECL+; the band corresponding to otoferlin is marked by an arrow. C, Proteins specifically affinity-captured from both rat (solubilized with CL-48; y-axis) and mouse (solubilized with CL-99; x-axis) cochlea, plotted by their relative abundance (rPV) in the respective purification with anti-otoferlin versus IgG control (for calculation of rPV values see Materials and Methods); rPV values >10 indicate specific (co)-enrichment with otoferlin; dots represent individual proteins, subunits of the AP-2 complex are highlighted in red. D, E, RT-PCR analysis of AP-2. RT-PCR analysis of RNA samples from mature (P20) rat cochlea (D) and mature (P26) mouse IHCs (E). All four AP-2 subunits, Ap2a2, Ap2b1, Ap2m1, and Ap2s1, were found in the cochlea (D); in isolated IHCs, the two largest subunits Ap2a2, Ap2b1, were detected (E). Primer pairs each spanned at least one intron to distinguish between RNA and DNA signals. For more information see Materials and Methods.

