Figure 5.

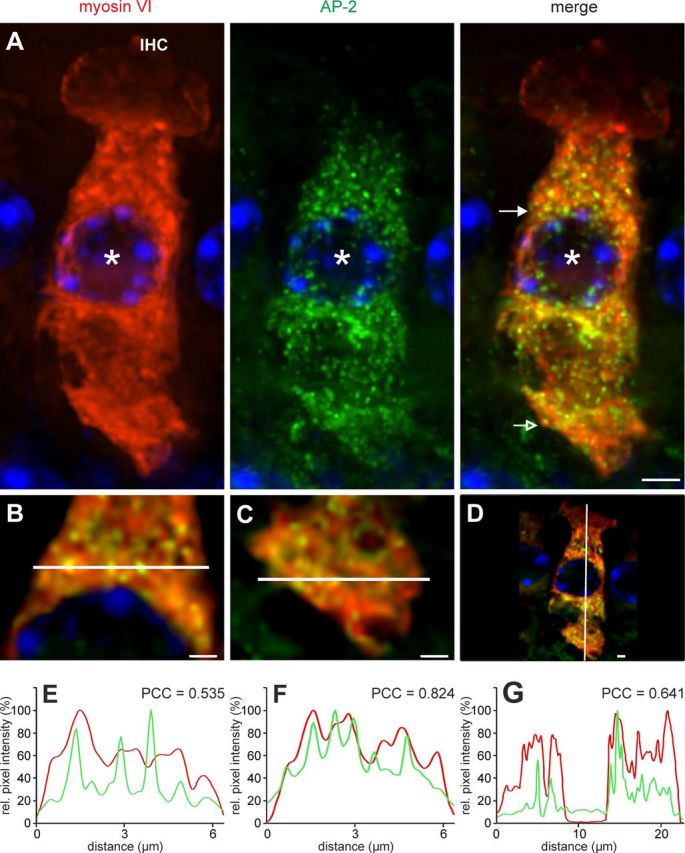
Colocalization of AP-2 protein and myosin VI in mature (P19) IHCs. A, Colocalization of myosin VI (red) and AP-2 (green) labeling was found ubiquitously throughout the IHC except the cuticular plate. Cell nuclei were counterstained with DAPI. Scale bar: 5 μm. B–D, To better display colocalization, merged images are shown displaying magnifications of single layers out of the deconvoluted z-stack in A, where B and E are derived from the supranuclear area (closed arrow in A, merge), C and F from the base (open arrow in A, merge), and D and G from a vertical cut. Scale bars: 2 μm. E–G, Normalized intensity profiles are drawn from the white lines in B–D and show the relative pixel intensity along the line with regards to the distance and fluorescence wave length (red, Cy3; green, Alexa 488). Colocalization was analyzed by coinciding of maxima of the red and green channel by PCC. Images display maximum intensity projections of all layers of a z-stack.
