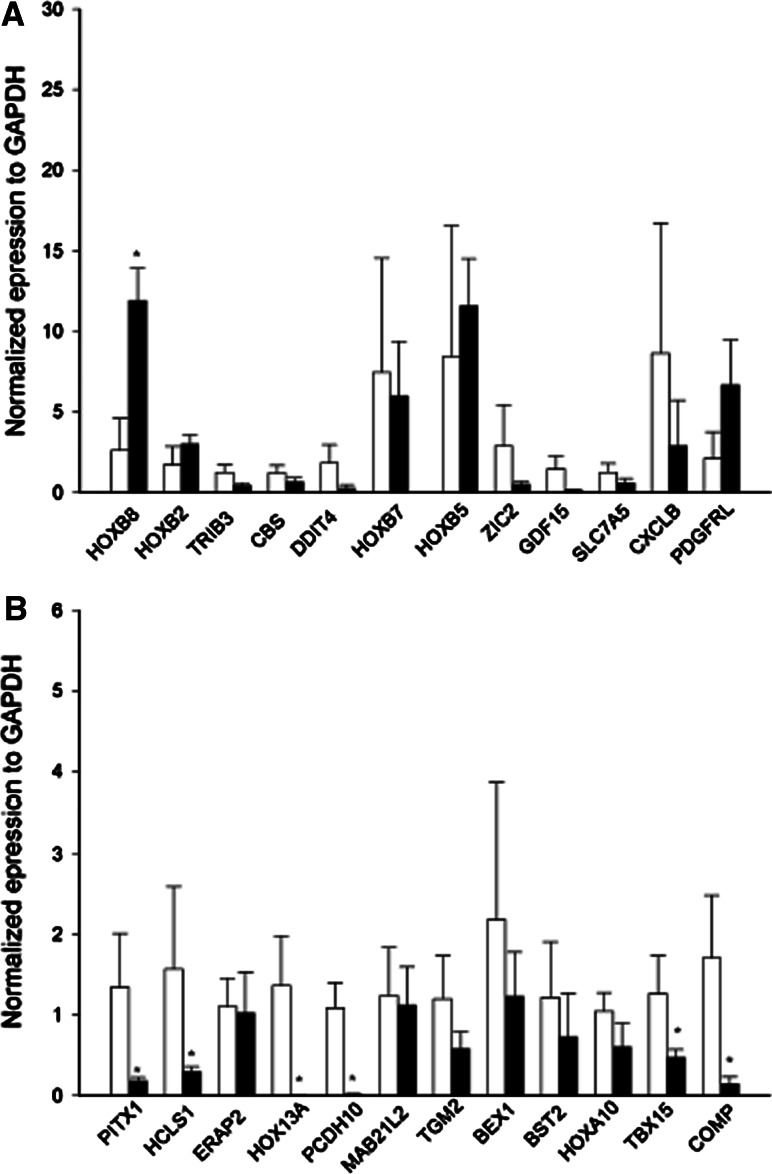
Fig. 3.
Validation of most up-regulated (a) and down-regulated (b) genes by RT-qPCR. The relative level of mRNA of regulated genes was analyzed by quantitative RT-PCR. Gene expression results are depicted as ∆Ct values, normalized to GAPDH. *p < 0.05, Student’s t test, AIS (■) versus control (□) expression levels

