
Fig. 4.
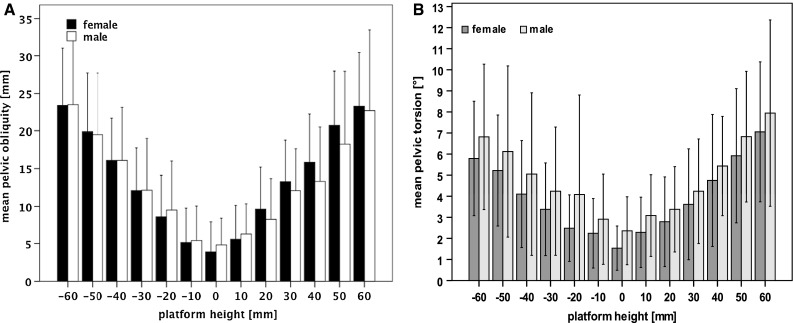
a Shows the mean pelvic obliquity in millimetres (with the 95 % confidence level) for the simulated different platform heights (0–60 mm) for the right side (positive values) and left side (negative values). An increase in platform height leads to an increase in pelvic obliquity on the corresponding side. b Demonstrates the changes of the pelvic torsion in degrees with the simulated platform heights of up to 60 mm. The changes in pelvic torsion are significant between the neutral position (0 mm) and platform heights ≥20 mm on the right side and ≥30 mm on the left side. No significant differences were found between females and males