
Fig. 3.
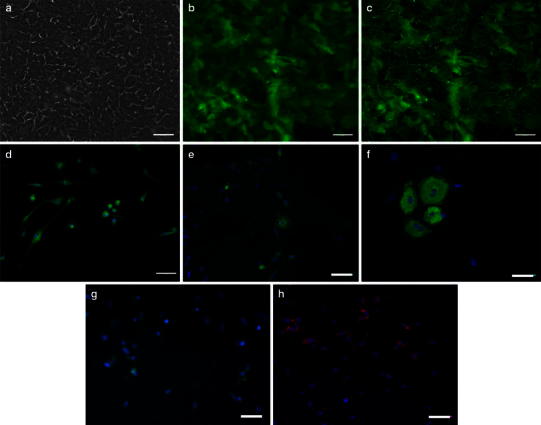
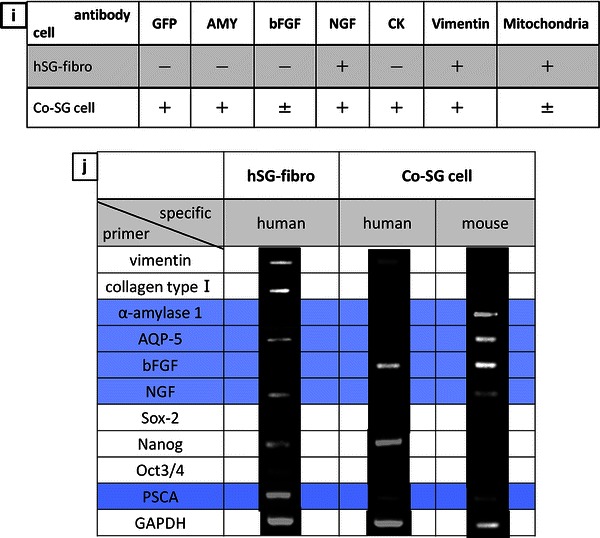
Confirmation of cells characteristics after co-culture with mEES-6 cells and hSG-fibro. a Phase-contrast micrograph. b Fluorescence micrograph. c Merged images of phase-contrast micrograph and fluorescence micrograph. Micrographs of (b, c) stained with antibody. d–h Immunostaining image: d green fluorescent protein (GFP), e amylase, f cytokeratin (CK), g basic fibroblast growth factor (bFGF), h nerve growth factor (NGF). Cell nuclei depicts with DAPI staining (blue). Scale bars 50 μm. i A summary of the immunofluorescence results indicating positive (+) or negative (−). j Confirmed changes in gene expression by RT-PCR before and after co-culture