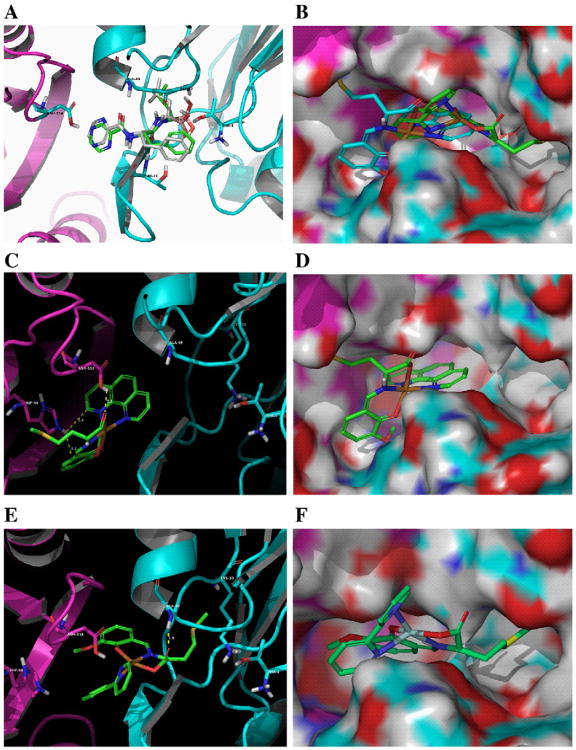
Fig. 7.
Docking poses obtained by means of software GLIDE. (A) Bortezomib (white carbons) compared to its crystal pose (green carbons) (PDB:2F16). (B) Overlap of C1 (blue carbons) and C2 (green carbons) by molecular surface visualization. Copper in orange, β5 in cyan, and β6 in purple. (C and D) C1 using a ribbon backbone representation and a molecular surface representation by space filling, respectively. (E and F) C2 using a ribbon backbone representation and a molecular surface representation by space filling, respectively. Distances of intermolecular interactions are in yellow.

