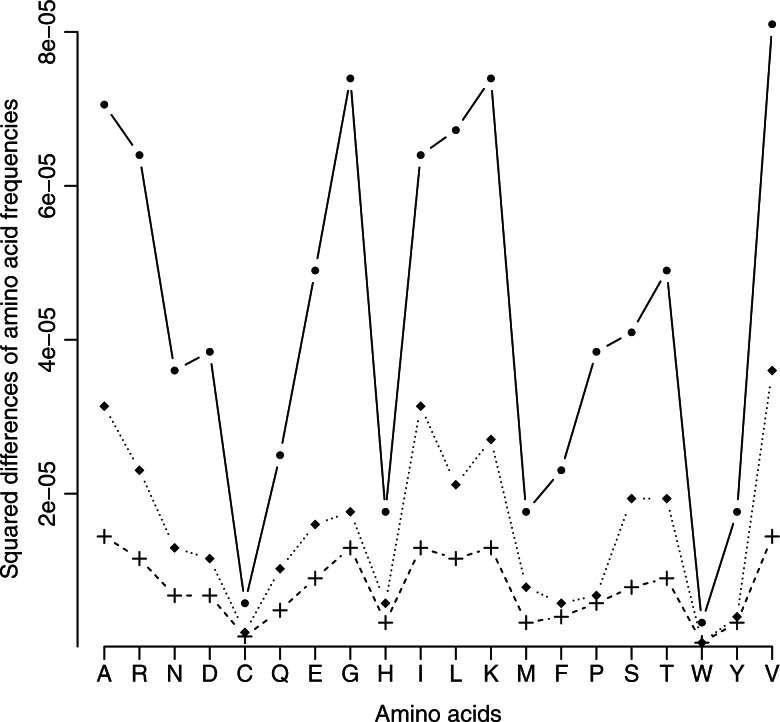
Figure 3.
Accuracy of the phylogenetic signal capture. The H, H–NS, and NH–NS approaches are compared. For each of the original 1000 simulated alignments, parameters estimates were obtained with each one of the three approaches. From these estimates, new alignments were simulated with BppSeqGen. For each of the 20 sequences per alignment, the amino acid frequencies were computed and compared with the amino acid frequencies observed in the original alignments. The medians of squared differences for each amino acid frequency are represented. Solid line: H–S model. Dotted line: H–NS model. Dashed line: NH–NS model. The NH–NS approach is the best approach regarding the modeling of evolutionary processes and the capture of the phylogenetic signal present in the data.

