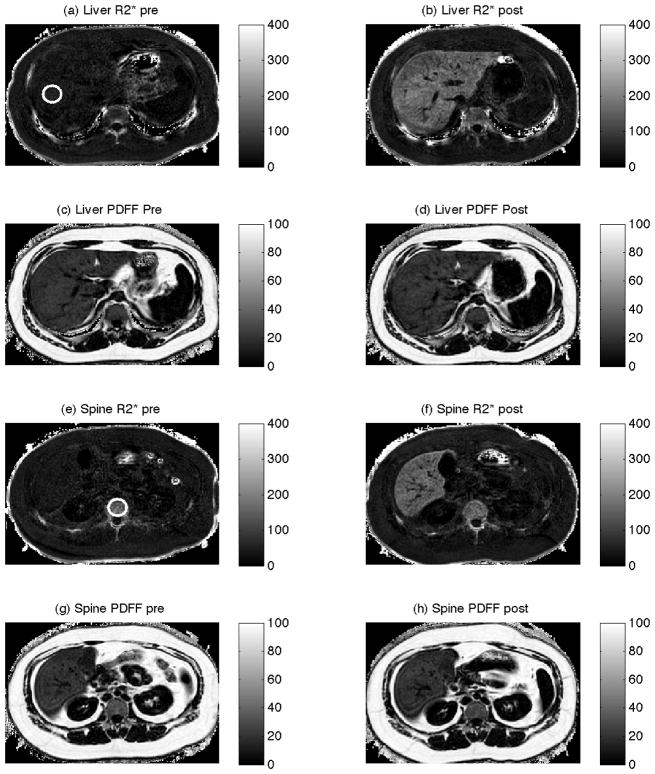
Figure 1.
Axial data from Subject 3 before (left column) and after (right column) the administration of SPIO. The first and third rows are measurements of R2* (s−1), and the second and fourth rows are measurements of proton density fat fraction (PDFF) (%). The axial slices from the top two rows were selected to evaluate the liver, and the bottom two rows were selected to evaluate the spine. Circles in panels (a) and (e) indicate regions of interest in the liver and spine.

