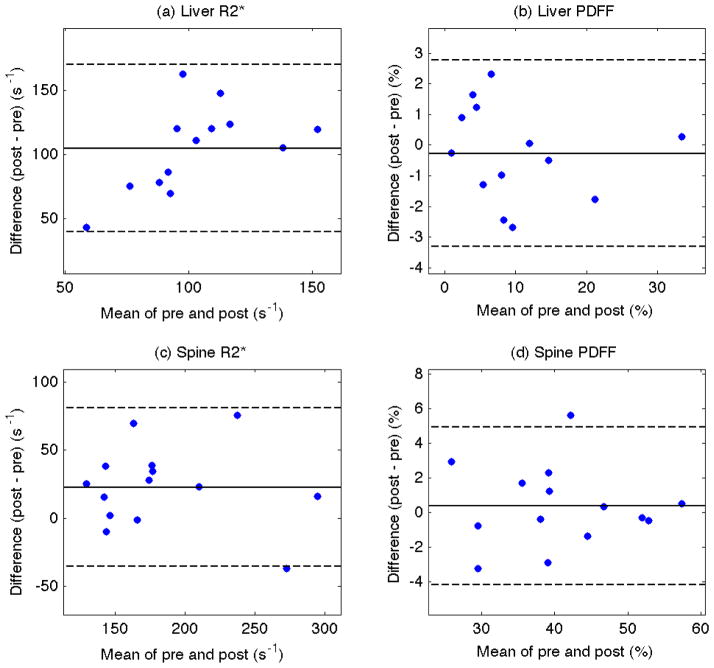
Figure 2.
Bland-Altman plots of R2* (left column) and proton density fat fraction (right column) measurements for each subject from the liver (top row) and spine (bottom row). The difference (y-axis) versus mean (x-axis) of the signal intensities in the regions of interest of each subject are shown. The mean difference (solid horizontal line) and ± 1.96 standard deviation (dash lines) are also shown.

