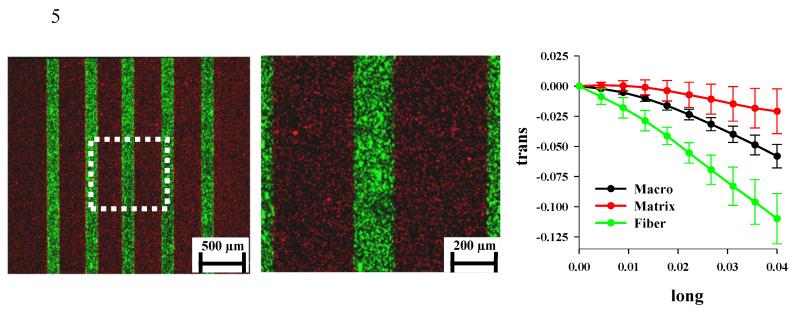
Figure 2.
Confocal images of surrogate constructs and results for microscopic/macroscopic strain measurement. (Left) A dual channel 4X image shows the red fluorescent beads in the gel matrix and the green fluorescent beads in the fiber. The dotted white box shows the location of the field for the 10X image that was used for strain analysis. (Middle) The 10X image from the center of the surrogate used for computing the microscale fiber and gel strain. (Right) The macroscopic transverse strain (black line) was not representative of the microscopic fiber strain (green line) or matrix strain (red line). The error bars represent the standard deviation computed for all samples.

